If You'd Invested $1,000 in Coca-Cola in 1970, Here's What It Would Be Worth Today
In January 1970, Coca-Cola was already an American institution. The Beatles were still together, a gallon of gas cost 36 cents, and a share of Coca-Cola cost about $82. If you had put $1,000 into KO stock that month and then done absolutely nothing — no trading, no timing, no panic-selling — here is what would have happened.
That is a total return of 25,224%, or about 10.2% a year for 56 years. The number comes from total-return data that assumes every dividend was reinvested. It is not a typo. A boring soda company turned $1,000 into a quarter of a million dollars.
The twist: the index did even better
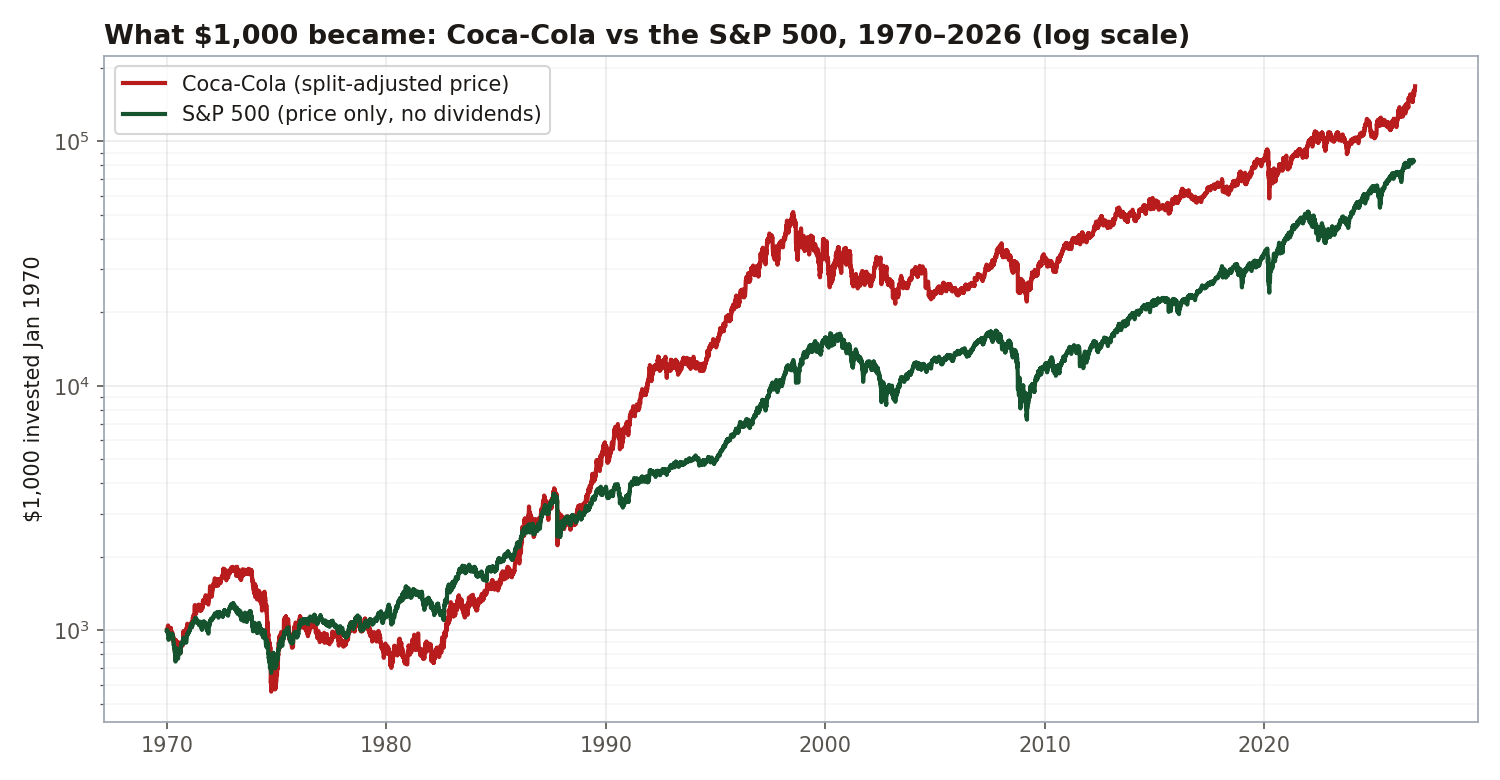
Before Coca-Cola fans start celebrating, here is the uncomfortable part. The same $1,000 in the S&P 500 at the start of 1970 — also with dividends reinvested — would be worth about $393,580 by the end of 2026. The plain index beat one of the most famous dividend stocks in history.
That is not a knock on Coca-Cola. It is a lesson about how hard it is to beat the market, even for a wonderful business held for half a century. Keep that in mind — we will come back to it.
Decade by decade
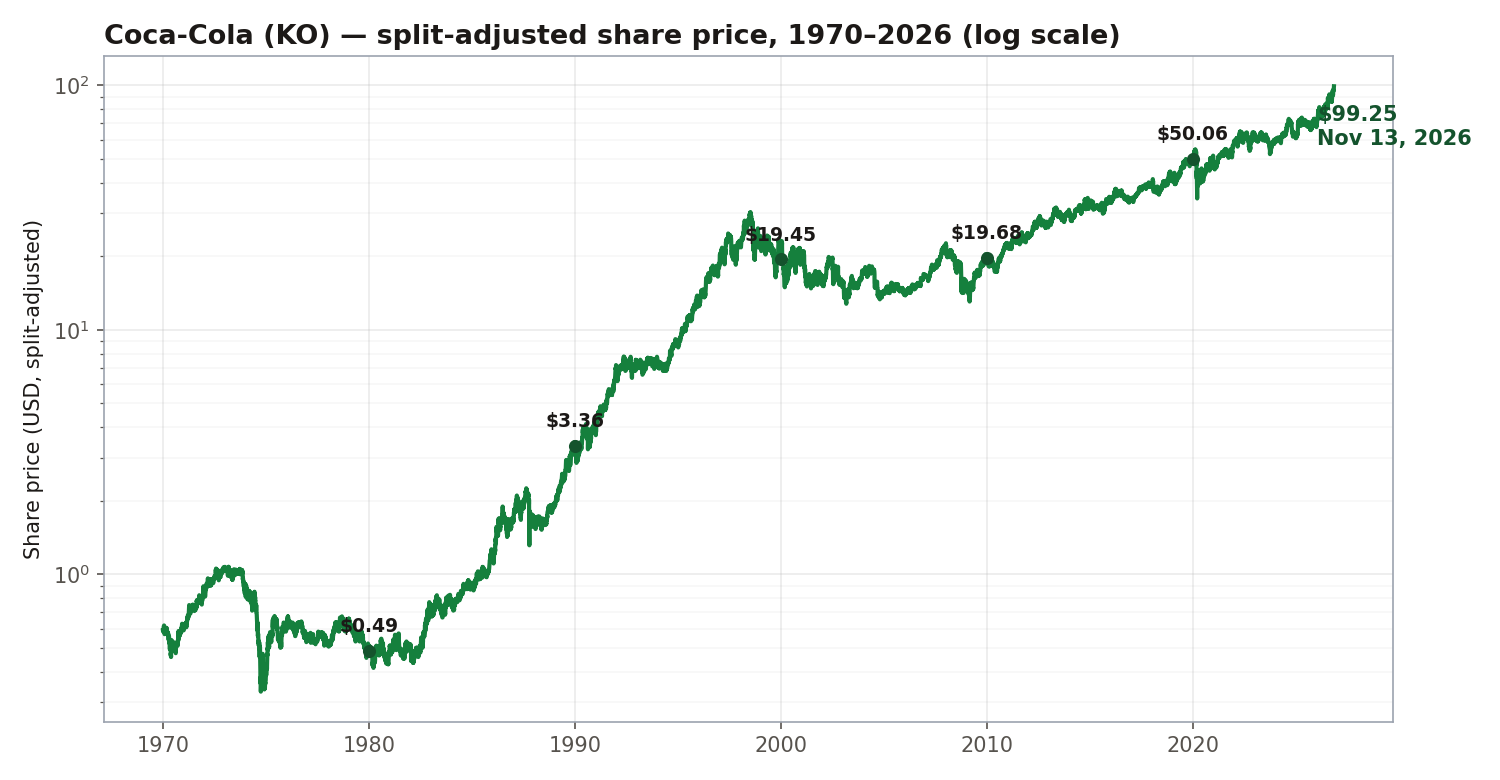
The road to $252,240 was anything but smooth. Here is the split-adjusted share price at the start of each decade, from our daily price database:
| Year | Share price | $1,000 became (price path) |
|---|---|---|
| 1970 | $0.59 | $1,000 |
| 1980 | $0.49 | $824 |
| 1990 | $3.36 | $5,701 |
| 2000 | $19.45 | $32,963 |
| 2010 | $19.68 | $33,347 |
| 2020 | $50.06 | $84,824 |
| Nov 2026 | $99.25 | $168,163 |
Read that first row again: after ten years, your $1,000 was worth $824. You had lost money for an entire decade. The 1970s were brutal for Coca-Cola — the stock fell 69% from early 1973 to October 1974, during the Nifty Fifty crash. Anyone who bought in 1970 and checked back in 1980 would have concluded the whole idea was a mistake.
Then came the 1980s and 1990s. The stock roughly quadrupled in the 1980s and grew almost sixfold in the 1990s. The 2000s gave back nothing — $32,963 in 2000 became $33,347 in 2010, a lost decade again. The 2010s and 2020s did the rest.
Where the money really came from: dividends
Here is the part most “if you'd invested” stories skip. The $168,163 in the table above is the price path. The headline $252,240 includes reinvested dividends — and the gap between them is the story.
- Price alone: about $116,000 (the share price, adjusted for six stock splits, rose from about $82 to $99.25).
- With dividends reinvested: $252,240.
- Dividends contributed: roughly $136,000 — more than half of the final value.
Coca-Cola has raised its dividend for 63 consecutive years, making it one of the longest-running Dividend Kings in the market. Every quarter, the company handed shareholders cash, and shareholders who reinvested it bought more shares, which paid more dividends. Compounding did the quiet work while nobody was watching.
Four crashes survived
Coca-Cola did not glide to $252,240. It fell off cliffs, repeatedly:
| Crash | Peak to trough |
|---|---|
| 1973–74 (Nifty Fifty crash) | −69.1% |
| 1987 (Black Monday) | −41.6% |
| 2008–09 (financial crisis) | −42.3% |
| 2020 (COVID) | −37.0% |
Each time, the business kept selling soda. Each time, the dividend kept arriving. Each time, the price eventually came back — it just took years, and it took an investor willing to hold through the kind of drawdown that makes headlines.
So, should you buy Coca-Cola?
That is not what this article is for. The past 56 years say three things, and none of them is a buy recommendation:
- Time did the work, not cleverness. The entire return came from holding one good business for 56 years. There was no trading strategy involved.
- Dividends were more than half the outcome. Ignore them and you misunderstand the whole story.
- Even a great company can lag the index. Coca-Cola is a wonderful business. The S&P 500 still beat it by more than $140,000 on the same $1,000. That is why the “just buy the index” argument is so hard to dismiss.
The honest takeaway is not “buy Coke.” It is that the biggest force in investing is not picking the perfect stock — it is staying invested, reinvesting dividends, and giving compounding decades to work.