If You'd Invested $1,000 in Apple in 1984, You'd Have $4 Million Today
Apple in 1984 was the company that had just launched the Macintosh with the most famous Super Bowl ad ever made. It was also a company drifting toward chaos: Steve Jobs would be pushed out the next year, and the stock would spend the next decade going mostly sideways and down.
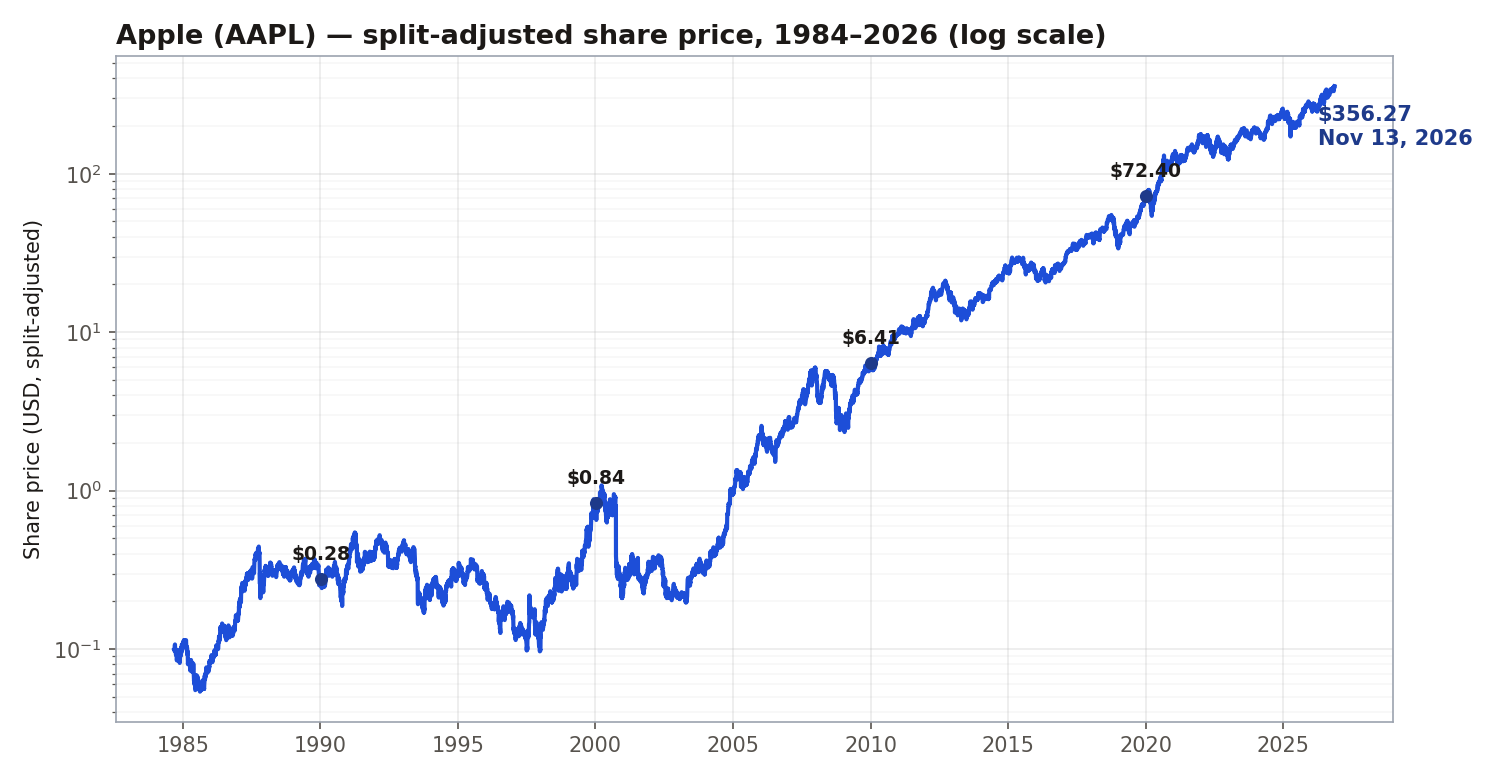
If you had put $1,000 into Apple in late 1984 — our price data starts on September 7, 1984 — and held it until today, here is the result:
That is a return of 403,770%, roughly 22% compounded every year for 42 years. It is one of the greatest wealth-creation runs in market history. It is also a story that almost nobody actually lived, because to collect it you had to survive the part where the company nearly died.
The lost decade (1984–1997)
Apple's first decade as a public company after 1984 was miserable for shareholders:
| Year | Share price* | $1,000 became* |
|---|---|---|
| 1984 | $0.10 | $1,000 |
| 1990 | $0.28 | $2,811 |
| 2000 | $0.84 | $8,451 |
| 2010 | $6.41 | $64,641 |
| 2020 | $72.40 | $729,845 |
| Nov 2026 | $356.27 | $3,591,431 |
*Split-adjusted price path from our database; the true total with all dividends reinvested is higher (see methodology).
By 1997, Apple was 90 days from bankruptcy by some accounts. The stock fell 56% between August and December 1997 alone. In August 1997, Microsoft — Apple's great rival — invested $150 million to keep Apple alive, and Steve Jobs returned as interim CEO. Investors who bought in 1984 had waited 13 years and were sitting on roughly $1,000 of value for their $1,000. Thirteen years, zero gain, one near-death experience.
Then everything changed — twice
Apple's annual returns tell the story in one glance. The best year ever was 1998 (+212%), the year after Jobs returned. The worst was 2000 (−71%), when the dot-com crash cut the stock by almost three quarters. Since 1981, Apple has risen about 19% a year on average — but the average hides years of +212% and −71% sitting side by side.
The real inflection came in two waves:
- 2001–2007: the iPod and the iPhone. The iPod (2001) made Apple a consumer company again; the iPhone (2007) made it the most valuable company on earth. The stock rose 201% in 2004 and 133% in 2007.
- 2010–2026: the compounding machine. Once the iPhone became a platform — App Store, services, wearables — the growth turned steady. From $6.41 at the start of 2010 to $356.27 in November 2026, the stock rose more than 55-fold in 17 years.
What about buying at the IPO?
Apple went public on December 12, 1980, at $22 a share. Here is a surprise: buying at the IPO worked out worse than buying in late 1984. The total return since the IPO is about +363,441% — $1,000 became roughly $3.63 million — slightly less than the $4.04 million from a December 1984 start. The stock spent its first four public years falling, so the patient 1984 buyer started from a lower base.
That is a useful reminder: the starting price matters enormously, and “buy the IPO” is not automatically the best version of a great story.
The catch (there is always one)
Three honest caveats, before anyone gets carried away:
- Survivorship bias. We are telling Apple's story because Apple survived. For every Apple, there were dozens of 1980s computer companies — Osborne, Commodore, Wang — that went to zero. Picking the survivor in advance was the hard part.
- Nobody held perfectly. The 22%-a-year figure assumes you never sold, never panicked in 1997, 2000 (−71%), 2008 (−57%) or 2022 (−26%), and reinvested every dividend. Real humans almost never do that.
- The future is not 1984. Apple is now a $5 trillion company. It cannot compound at 22% a year for another 42 years — that would make it worth more than the entire world economy several times over.
Apple's story is not a prediction. It is proof of what long holding periods can do when a business transforms itself — and proof of how much patience that transformation demands.