5 Lessons from 60 Years of Stock Market Data (1962–2026)
Sixty years is long enough to see everything: booms, crashes, bubbles, wars, pandemics, and the slowest, quietest wealth-building force in history — compounding. We went through 11.8 million daily stock prices, from 1962 to November 2026, and five lessons kept showing up. Here they are, with the numbers.
Lesson 1: Time in the market beats timing the market
$1,000 in the S&P 500 at the start of 1970, with dividends reinvested, became about $393,580 by the end of 2026 — 11.1% a year for 57 years. That return was earned by doing nothing. No market calls, no sector rotation, no panic selling.
The catch: to earn it, you had to sit through every crash in the table below. The investors who earned 11.1% a year are the same investors who watched their money fall by half — twice — and stayed invested anyway.
Lesson 2: Dividends do the heavy lifting
Look at the same $1,000 in the S&P 500 two ways:
| $1,000 in 1970 became | |
|---|---|
| Price only (no dividends) | ≈ $82,900 |
| With dividends reinvested | ≈ $393,580 |
Dividends turned $82,900 into $393,580. Roughly a third of the market's long-run total return comes from reinvested dividends, and over decades the reinvested dividends end up buying most of your final position. Coca-Cola tells the same story: $1,000 in 1970 became about $116,000 on price alone, but $252,240 with dividends reinvested — more than half the final value came from the dividend stream.
Price charts hide this completely. Every chart that shows only the index level is understating what long-term investors actually earned — by a factor of nearly five.
Lesson 3: Every crash recovered — but “eventually” can mean years
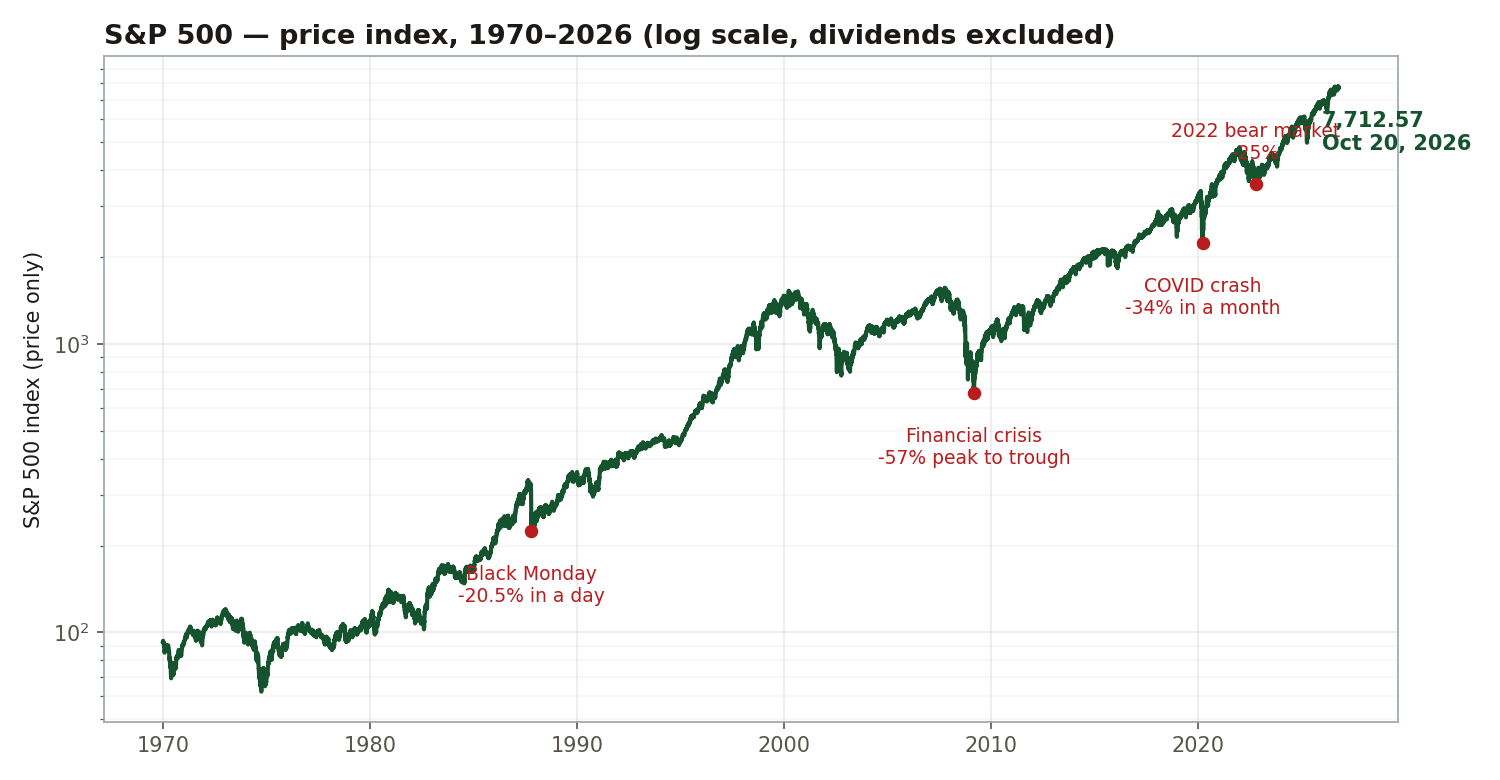
Here is every major S&P 500 drawdown in our data, and how long recovery took:
| Crash | Peak to trough | Back to the old peak |
|---|---|---|
| Black Monday, Oct 1987 | −20.5% in one day | About 2 years |
| Dot-com bust, 2000–02 | −49.1% | May 2007 (~7 years) |
| Financial crisis, 2007–09 | −56.8% | March 2013 (~5.5 years) |
| COVID, Feb–Mar 2020 | −33.9% | August 2020 (~5 months) |
| 2022 bear market | −25.4% | About 2 years |
Two things stand out. First, the market recovered every single time — 100% of the time, over 60 years. Second, the recovery was never fast when it mattered most: after 2000 it took seven years, after 2008 more than five. The investors who recovered were the ones who could afford to wait. That is not a market lesson; it is a life lesson about keeping cash for emergencies so your investments never have to be sold at the bottom.
Lesson 4: The winners keep changing
In 1962, our database holds just two stocks: GE and IBM. They were the giants of the industrial age. By 1970 there were 26; by 2020, more than 2,000. The cast changed completely:
- Energy was about 28% of the U.S. market in 1980. Today it is under 4%.
- Technology was about 6% in 1990. Today it is roughly 37–40% — the biggest sector in the market.
- Coca-Cola fell 69% in 1973–74, then became one of the great compounders. Apple nearly died in 1997, then became the most valuable company in history.
The lesson is not to chase today's winners. It is that today's winners were yesterday's nobodies, and that a portfolio built on one era's giants is a bet that the era never ends. Broad diversification is not a compromise — it is the only honest response to the fact that nobody knows which sector runs the next 30 years.
Lesson 5: Most stocks don't beat a Treasury bill
This is the most sobering finding in 60 years of data. Research by Hendrik Bessembinder (Arizona State University) found that 57–58% of all U.S. stocks from 1926 to 2016 delivered lifetime returns below one-month Treasury bills — the return you would have earned by doing nothing and holding cash. Just 4% of stocks created all of the stock market's net wealth above Treasury bills.
Read that again: more than half of all stocks were worse than holding cash. The market's great long-run return was produced by a tiny minority of extreme winners — Apple, Microsoft, Coca-Cola in their prime — while the median stock quietly lost to a savings account.
That is why picking individual stocks is so hard, and why the index — which automatically owns the winners — has beaten most stock-pickers over long periods. You do not need to find the next Apple. You need to make sure you own it when it appears.
The bottom line
Sixty years of data says the same thing in five different ways: the market rewards patience, dividends, diversification, and the ability to do nothing during a crash. It punishes timing, concentration, and the belief that this time is different.
None of this is a promise. The next 60 years will have their own crashes, their own new sectors, and their own Apple that nobody sees coming. The data cannot tell you what to buy. It can only tell you what has worked for the people who stayed invested the longest — and what has not.